
It seems like crime mapping sites are a dime a dozen these days but a new one caught my eye. Linked to by Bossert over at WRB, CrimeMapping.come lets you select & aggregate crime reports for a given time period all in a friendly Web 2.0 interface.
Show your bad side SCV:
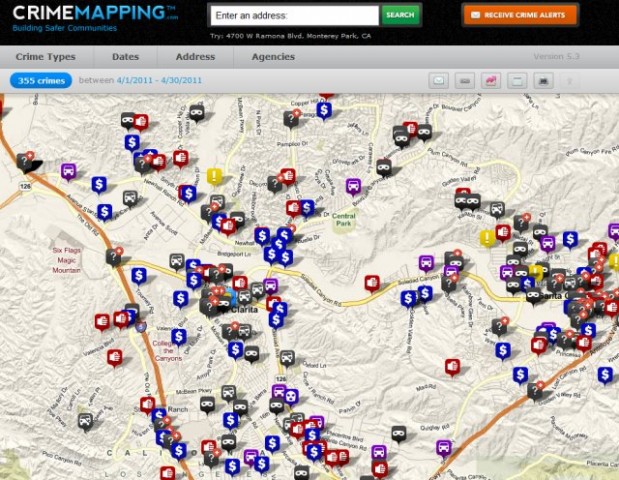 I filtered the above map by simply zooming out and taking a look at all reported crimes committed between April 1 and April 30, 2011. There are 349 crimes on the map.
The site even has an interesting (if primitive) “Trends” button which groups crimes by categories and shows when we SCVers are feeling violent or grabby. (Hint: it’s usually Friday and Saturday nights)
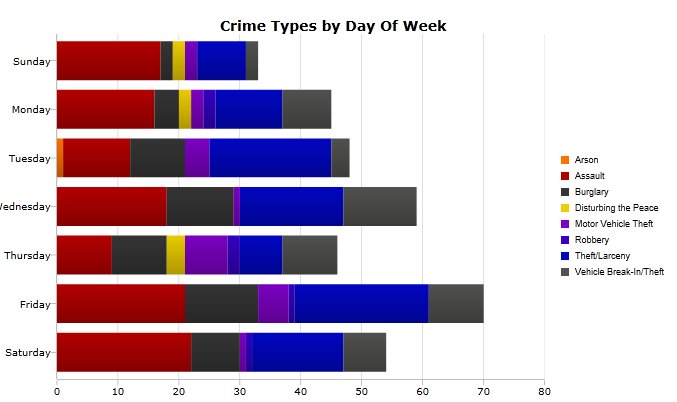
Of course if it was a true trending tool, it would not just tell me what crimes happened, but, Minority Report style, when and where they are going to happen in the future.
It also doesn’t group crimes by community, zip code, or neighborhood tract, which would be useful for all sorts of things like deciding where to buy your next home or using such data as ammunition in our on-going and neverending bashing of Stevenson Ranch and/or Canyon Country.
But anyway, go on over and check it out.
Comments
8 · as published