
Not all campaigns are created equal. In 2010, we saw Frank Ferry come within a busload of voters to being upset by newcomer David Gauny. Frank Ferry raised almost the same money from the same donors as the other incumbents on the ballot, yet he fared far worse. Gauny’s late application of good strategy couldn’t have been more apparent. He did spectacularly good with poll voters, but not so well with vote-by-mail’ers – even those who dropped off their ballot on election day (in short: phone lists).
The candidates in this election approached their campaigns quite differently from one another. As of March 25th (the last filing) Kellar outraised everyone. Ed Colley didn’t raise a dime. TimBen played it smarter than last time. Jon Hatami peaked early and flamed out with weeks to spare and Laurie Ender had such a late start, people wondered if she was going to campaign at all.
So before results roll in, I thought it would be interesting to see how the candidates spent their money.
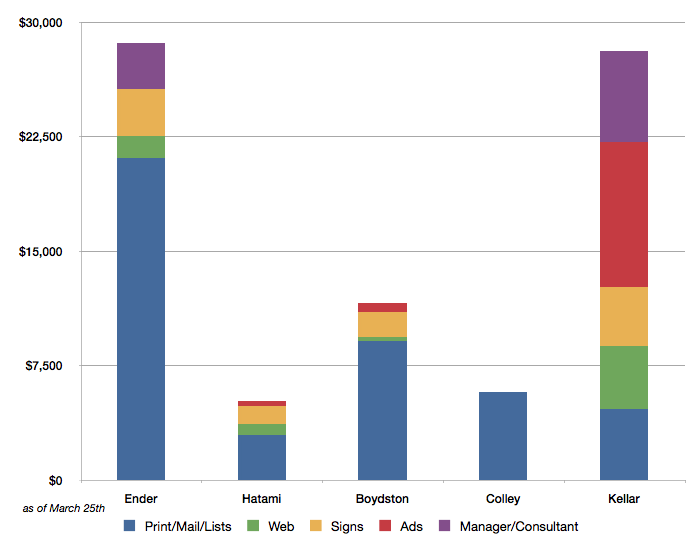
| Print & Mail | Web | Signs | Ads | Consultant/ Manager |
|
| Ender | $21,063 | $1,480 | $3,087 | $3,000 | |
| Hatami | $2,967 | $690 | $1,189 | $350 | |
| Boydston | $9,094 | $250 | $1,679 | $595 | |
| Colley | $5,751 | ||||
| Kellar | $4,634 | $4,152 | $3,860 | $9,475 | $6,000 |
These numbers have been gently rounded and they’re based on my best guesses from examining their disclosure forms. I grouped expenditures for mail, print and call lists together, because they are hard to separate (the call list might also be the mail list, etc.). I also didn’t include boring things like insurance, filing fees and rubber chicken.
Kellar took the road less traveled, and in a few hours, we’ll know if his bets paid off.
Comments
8 · as published